Color Phenomena of Blue Amber
ABSTRACT
The greenish blue color observed in some amber from the Dominican Republic and Indonesia is actually fluorescence stimulated by ultraviolet (UV) light. A previous study described the color as iridescence over a yellow background, but it is in fact a surface fluorescence. Since this amber can be considered a long-wavelength pass filter with a half-pass wavelength at about 530 nm in its spectral transmittance, it does not transmit either UV or short-wave visible light. As this material completely absorbs light in the UV range and strongly absorbs light in the short-wave visible range, the stimulated blue color is confined exclusively to the surface. The amber from this study also showed the Usambara effect, the phenomenon in which color varies with the path length of light through a sample.
INTRODUCTION
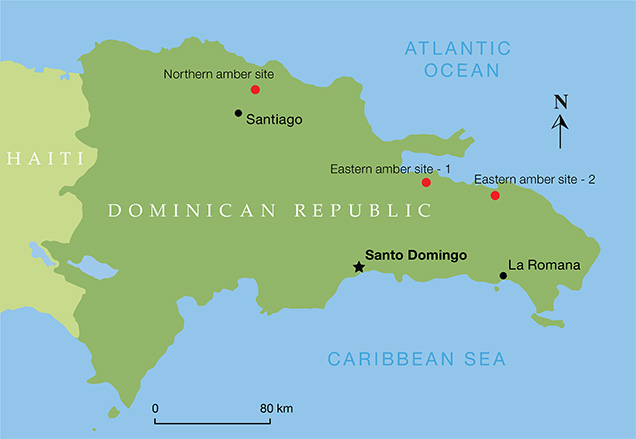
Amber is fossilized tree resin used for jewelry, decoration, medicine, and perfume. Specimens with inclusions of insects and plants are of great scientific significance and highly esteemed by collectors. Amber is usually yellow to brown, and some specimens display red to brownish red or reddish brown colors. Blue amber is rare, found mainly in the Dominican Republic with some production from Indonesia and Mexico. This variety comes from the resin of the extinct tree species Hymenaea protera (Iturralde-Vinent and MacPhee, 1996; Poinar and Poinar, 1999). According to Iturralde-Vinent and MacPhee (1996), most Dominican amber occurs in two zones: north of Santiago de los Caballeros (the “northern area”) and northeast of Santo Domingo (the “eastern area”).
Although resinites of different ages exist, available biostratigraphic and paleogeographic data suggest that the main amber deposits in the Dominican Republic (including those famous for yielding biological inclusions) were formed in a single sedimentary basin during the late Early Miocene through early Middle Miocene (15 to 20 million years ago). There is little evidence of extensive reworking or redeposition of the ambers. Before the studies of Iturralde-Vinent and MacPhee (1996), amber from the northern area was thought to have formed during the Early Eocene to Early Miocene epochs (Baroni-Urbani and Saunders, 1982; Lambert et al., 1985; Poinar and Cannatella, 1987; Grimaldi, 1996), while published estimates for the eastern area ranged from the Cretaceous to Holocene epochs (Burleigh and Whalley, 1983; Poinar and Cannatella, 1987; Grimaldi, 1996).
Bellani et al. (2005) studied blue amber from the Dominican Republic and identified the aromatic hydrocarbon component perylene as the source of the UV-stimulated fluorescence emission in the visible wavelength range from 430 to 530 nm, resulting in the observed greenish blue color. They also described the blue color as iridescence under natural daylight or daylight-equivalent lighting.
Iridescence is an optical phenomenon in which a surface appears to shift color as the viewing angle or angle of illumination changes (Nassau, 1983). Although most iridescence is caused by interference, Liu et al. (1999b) found that in pearls and shells it results from diffraction. Each layer of shell and pearl is optically heterogeneous. Light is strongly diffused as it passes through the layers, causing the milky white color observed. The diffused light cannot produce interference to cause the iridescence color. For this to happen, each layer would have to be optically uniform and have a thickness on the order of visible-light wavelengths.
UV fluorescence is also known to cause significant visible color change in some diamonds. Strong UV fluorescence under daylight caused such an effect in the 56.07 ct Tavernier diamond (Liu et al., 1998). The UV fluorescence changed the entire diamond’s bodycolor from light brown under incandescent light to light pink under daylight.
The phenomenon by which bodycolor varies with a gemstone’s thickness is called the Usambara effect. Liu et al. (1999a) determined that this color variation is caused by the hue angle change corresponding with the path length of light through a gem material.
This article presents the color phenomena of blue amber from the Dominican Republic and Indonesia. Fluorescence and photoluminescence were measured at room temperature to show the characteristic features. As a result, we found that the amber’s greenish blue color is only superficial. By calculating the colorimetric data at different depths within a sample, we determined that the hue angle changed with depth, an indication of the Usambara effect in blue amber.
MATERIALS AND METHODS
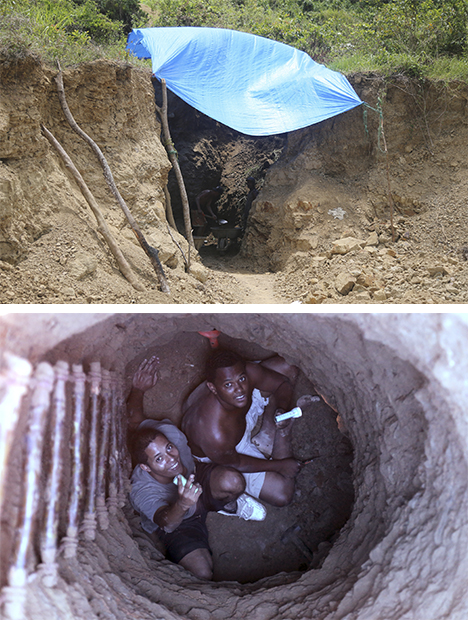
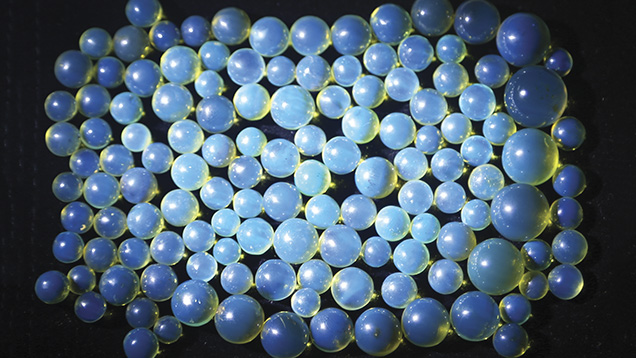
In 2013, one of the authors visited amber deposits in the northern and eastern parts of the Dominican Republic (figure 1). Figure 2 shows a typical mining operation, while figure 3 shows blue amber beads acquired from the local miners.
In the northern area, the upper 300 meters of the La Toca Formation of 1,200-meter-thick clastic rocks contains the amber-bearing unit, composed of sandstone with occasional conglomerate that accumulated in a deltaic to deep-water environment. Amber fragments in this deposit, which measure up to 40 cm in length, show few surface signs of transportation. Lignite occurs in the form of thin lamellae within the sandstones. These clastic rocks grade into flyschoid, with deeper-water deposits containing detrital amber.
In the eastern area, the amber-bearing sediments in the approximately 100 m thick Yanigua Formation are composed of organically rich laminated sand, sandy clay, and some intercalated lignite layers up to 1.5 m thick. Amber pieces occur in the lignite and the sandy clay. In addition to indicative sedimentary features, the characteristics of the invertebrate and vertebrate fossils from these beds—crocodiles, sirenians, and turtles—imply that deposition occurred in a near-shore context, probably in coastal lagoons fronting low, densely forested hills (Brouwer and Brouwer, 1982).
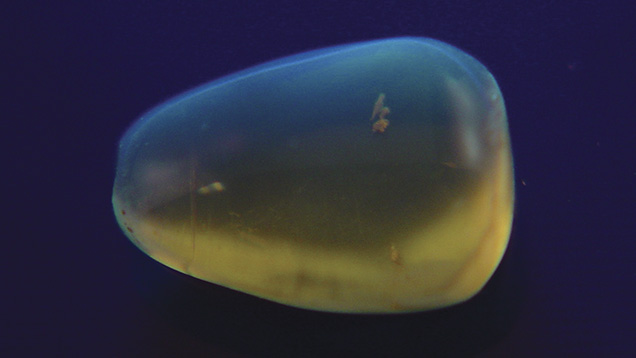
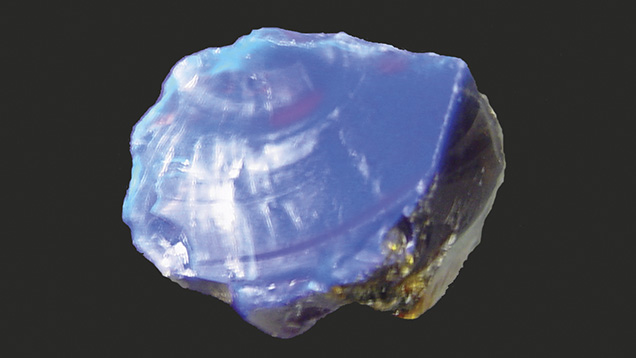
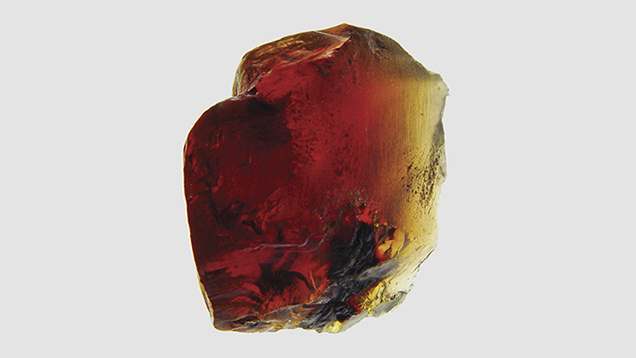
Two blue amber samples were studied. Sample 1, a cabochon from the Dominican Republic, appeared to have a greenish blue surface color and a yellow bodycolor (figure 4). Sample 2, a rough Indonesian amber with one surface polished, showed blue color on the polished surface and a red bodycolor (figure 5). Both samples showed very strong greenish blue fluorescence under long-wave UV radiation at 365 nm, and weak fluorescence under short-wave UV at 254 nm. Both also showed greenish blue phosphorescence that lasted several seconds.
An MDIS-f8 multifunction dual integrating sphere spectrometer was used to measure the samples’ spectral transmittance and UV fluorescence so that we could calculate hue and saturation. The optical arrangement for measuring the greenish blue fluorescence is shown in figure 6. The polished surface of sample 2 was held at a 45° angle to the sample stage. A 365 nm light-emitting diode (LED) was used to illuminate the polished surface at a 45° angle to excite blue fluorescence. A portion of the blue fluorescence passed through the aperture into the integrating sphere, where it was collected by a collimator and sent to the spectrometer for measurement. The spectrometer was calibrated by a radiometric calibration lamp to measure the relative spectral power distribution of the blue fluorescence rather than the digital counts. Therefore, the measured blue fluorescence spectrum was true in spectral power distribution.
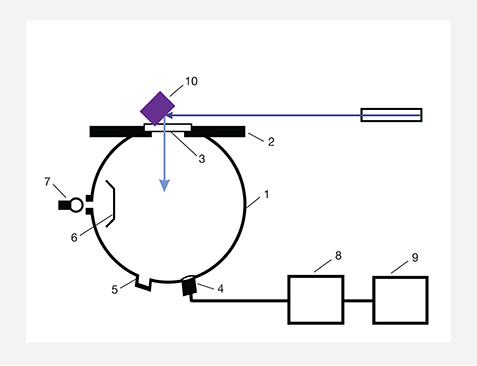
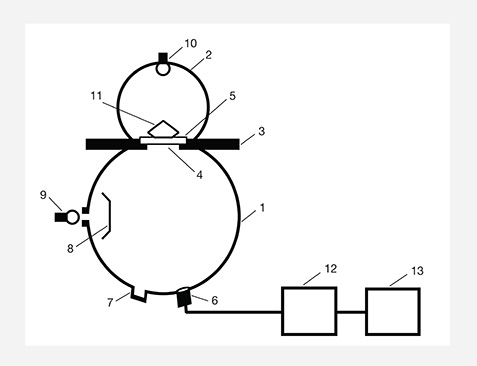
Figure 7 shows the optical arrangement for measuring spectral transmittance using the multifunction spectrometer with a xenon-filled tungsten lamp at the top of the integrating sphere. We placed an unpolished area chipped from sample 2 that was about 1 mm thick on the measurement stage, where the diameter of the aperture was 3 mm. The light from the lamp at the top of the measurement integrating sphere passed through both the slice and the aperture, into the measurement integrating sphere. The collimator collected the transmitted light from the amber slice and sent it to the spectrometer for measurement. To measure the percentage of spectral transmittance, the spectrometer is calibrated to 100% without the sample on the stage, and to 0% by turning off the tungsten lamp.
SURFACE COLOR
Figure 8 shows the unpolished slice taken from sample 2. Figure 9 shows the slice’s spectral transmittance, which is essentially a typical long-pass transmittance spectrum with a half-pass wavelength at about 530 nm and a cutoff wavelength at about 450 nm. The slope is not steep at the short-wavelength end of the long-pass transmittance spectrum. The blue light with a wavelength shorter than 450 nm is completely absorbed, and the transmittance of visible light from 450 to 760 nm increases gradually. Thus, the 1 mm slice appears yellow, and the bodycolor of the amber appears orangy yellow to brown in the thicker area.
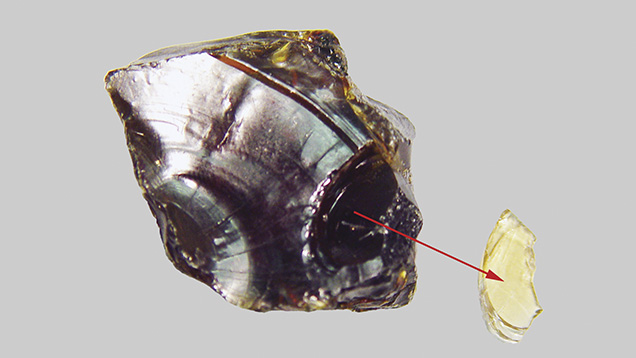
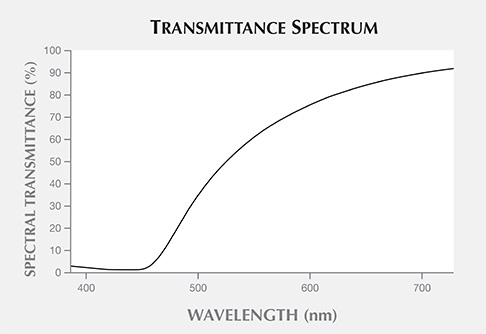
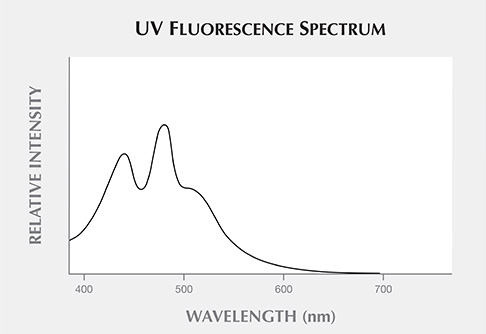
Figure 10 shows the UV fluorescence spectrum of sample 2, measured with a 365 nm UV light source. The UV light was incident to the surface of the sample, and the UV fluorescence was collected from the surface by the measurement integrating sphere component of the dual integrating sphere spectrometer. The UV fluorescence spectrum showed three peaks at around 450, 485, and 500 nm. This UV fluorescence spectrum was similar to the one recorded by Bellani et al. (2005). It is this short-wavelength fluorescence spectrum that causes the greenish blue surface color of blue amber.
When UV light struck the blue amber, it excited the greenish blue fluorescence. Because of the total absorption of UV light, however, it cannot penetrate into the blue amber. It can only cause blue fluorescence at the surface.
With increasing depth below the surface, the cutoff wavelength shifts to a long wavelength, and the greenish blue fluorescence is eventually totally absorbed. As this depth is still very shallow, the fluorescent light penetration is confined near the surface, limiting the ability to change bodycolor.
Figure 11 shows a lateral view of the greenish blue fluorescence of sample 2. To emphasize the greenish blue surface UV fluorescence, the photo was taken with a 365 nm UV light source. The UV light illuminated the blue amber from the right side, while incandescent light illuminated the top and bottom to show the bodycolor. The observed fluorescence agreed with the theoretical fluorescence based on the fluorescence measurements in the short-wavelength visible range (see figure 10).
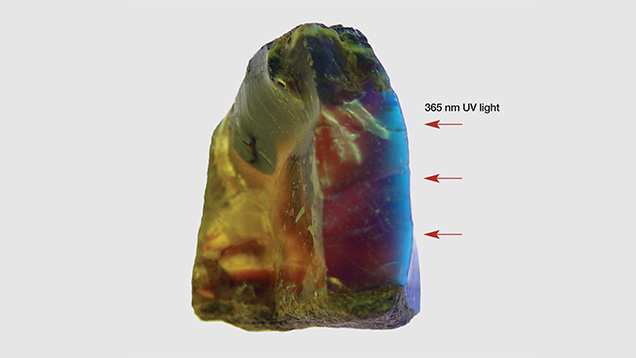
UV light cannot penetrate the amber’s surface, but fluorescence can penetrate to a shallow depth; therefore, the very strong greenish blue fluorescence cannot cause the alexandrite effect of bodycolor unless the sample is very thin. This is different from the alexandrite effect previously mentioned in the Tavernier diamond, where the greenish blue fluorescence penetrated the stone and caused a change in its bodycolor. The greenish blue fluorescence color of our amber samples was superficial.
UV fluorescence is generally very weak compared to the reflected or transmitted light of a material’s bodycolor under daylight or daylight-equivalent light, even if the UV fluorescence is very strong. This statement holds true for the greenish blue fluorescence of blue amber. Under daylight, the surface greenish blue fluorescence is difficult to observe, and only the yellow to brownish orangy red bodycolor is apparent. The surface fluorescence is usually observed when the blue amber is held against a black background. The black background limits light reflection, enhancing the fluorescence.
THE USAMBARA EFFECT
One surface of sample 2 was polished to form a wedge shape to show color change with different thicknesses. With increasing thickness, sample 2’s cutoff wavelength moves to longer wavelengths, and its transmission color changes from yellow to red (figure 12). The hue is yellow where the sample is thin and changes to brownish orangy red with increasing thickness.
| TABLE 1. Calculated relationship between thickness and hue angle and chroma of a blue amber sample. | ||
| Thickness (mm) | Hue angle | Chroma |
| 1 | 88.1° | 33.4 |
| 2 | 85.6° | 51.7 |
| 3 | 83.3° | 62.0 |
| 4 | 81.4° | 68.0 |
| 5 | 79.6° | 71.6 |
| 7 | 76.7° | 75.0 |
| 10 | 75.3° | 73.1 |
| 15 | 70.2° | 68.7 |
| 20 | 65.4° | 62.9 |
| 25 | 62.8° | 55.1 |
Table 1 shows the calculated relationship between the thickness and hue angle of sample 2 in the CIELAB color space under the CIE standard illuminant A at a color temperature of 2856 K, which represents the incandescent light used to observe the transmission color (Wyszecki and Stiles, 2000). Where the amber is 1 mm thick, its hue angle is 88.1° and its chroma is 33.4. The 88.1° hue angle represents a yellow hue, the 33.4 chroma a medium saturation. As the thickness increases, the hue angle becomes smaller and the chroma becomes higher. When the thickness reaches 7 mm, the hue angle is lowered to 76.7° and the chroma achieves its maximum saturation at 75.0. This hue angle and chroma represent an orange color with high saturation. When the thickness reaches 25 mm, the hue angle is reduced to 62.8°, observed as an orangy red hue, and the chroma becomes 55.1, representing a medium-high saturation.
Figure 13 shows the hue angle change of the blue amber in the CIELAB color space under the CIE standard illuminant A at 2856 K. The locus of these hue angles is a closed curve, with a hue angle variation of more than 20° in CIELAB color space. This locus is typical of the Usambara effect, which describes color variation with material thickness. In fact, many red and reddish brown ambers we have observed, with or without the blue fluorescence, clearly displayed the Usambara effect. As sample thickness increased, their bodycolor went from yellow to brownish orange or orangy brown, brownish red, or even red.
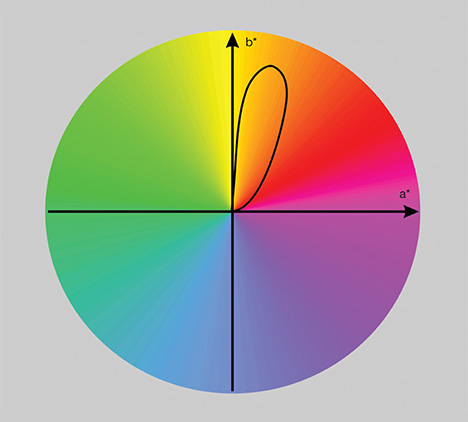
more than 20°, attributable to the Usambara effect.
CONCLUSION
The greenish blue color of blue amber from the Dominican Republic and Indonesia is caused by UV-stimulated fluorescence. The greenish blue fluorescence color is confined to the surface. There are two reasons for this: (1) UV light can only stimulate the greenish blue fluorescence on the surface of amber, and (2) amber strongly absorbs the greenish blue fluorescence light and does not allow it to penetrate much below the surface. Where a sample is thicker, the cutoff wavelength of the long-wavelength pass spectrum moves to a longer wavelength, and the greenish blue fluorescence can only penetrate a very thin layer of the amber. Thus, the blue fluorescence only appears on the surface.
Blue amber’s bodycolor changes with increasing thickness: yellow in areas less than 3 mm thick, orangy yellow to yellowish orange at approximately 3–6 mm, orange at 6–8 mm, and reddish orange and orangy red where the stone is more than 8 mm thick.


