Blue Spinel from the Luc Yen District of Vietnam
ABSTRACT
The Luc Yen district of northern Vietnam is a very productive gem province and the leading source of vivid blue spinel. This study characterizes the origin and gemological properties of these spinels, especially the cause of their unusually bright color, which is directly related to their value. Chemical and spectroscopic analyses indicated that the blue color is due to cobalt (Co2+), with some iron contribution. Petrographic examination identified the context of the gem’s formation, which appears to be linked to intense metamorphism during successive orogenies. The carbonate platforms in the ancient Paleo-Tethys Ocean were sandwiched and highly deformed during this orogeny, leading to marble and spinel formation. The authors propose that the cobalt (and to a lesser extent the iron) necessary for the blue color were transported by fluids during metamorphism of the sedimentary sequence.
INTRODUCTION
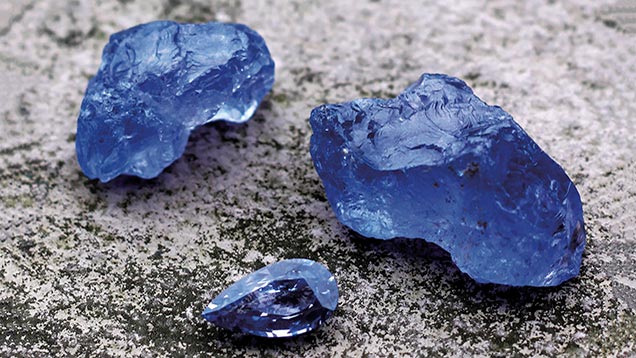
Blue spinels are mined in Sri Lanka, Tanzania, Myanmar, Pakistan, and Vietnam (Shigley and Stockton, 1984; Delaunay, 2008; Pardieu and Hughes, 2008). Vietnam’s two major spinel deposits, Luc Yen and Quy Chau, were discovered at the end of the 1980s. The Luc Yen deposits have mostly been mined since the 1990s (Pardieu and Hughes, 2008; Senoble, 2010). This area, known for its gem-quality ruby, red spinel, and sapphire (Webster, 1994; Hauzenberger et al., 2003; Long et al., 2004; Senoble, 2010; Huong et al., 2012), has also been a notable producer of vivid blue spinels since the 2000s (figure 1). Bright, saturated blue gems are very popular, as evidenced by the classic appeal of sapphire and the more recent trend of Paraíba tourmaline and bright blue apatite in the same color range. Therefore, the bright blue color of some spinels has increased the popularity of this gem overall (Delaunay, 2008; Senoble, 2010). In this article, we investigate the gemological characteristics of Vietnamese blue spinels and the geology of the deposits to gain a better understanding of this gem source.
LOCATION AND ACCESS
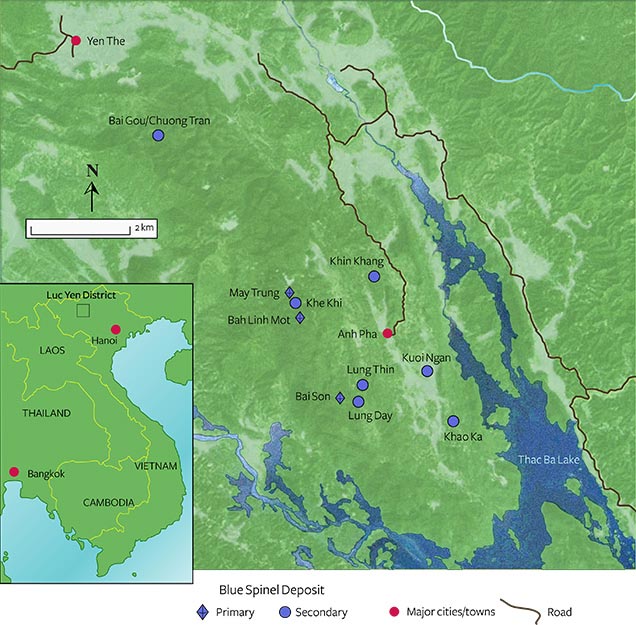
The Luc Yen district is located in the Yen Bai province, in the north of Vietnam. Luc Yen’s capital of Yen The (22°6′38.84″ N, 104°45′57.80″ E) is a five- or six-hour drive from Hanoi on a 160 km expanse of good road. All of the district’s blue spinel mining sites lie within 20 km of Yen The. Several hours of walking or biking are needed to access these mines. The blue spinel deposits are Bai Gou, May Trung, Bai Son, Bah Linh Mot, Khe Khi, Kuoi Ngan, Khao Ka, Lung Thin, Lung Day, Khin Khang, and Chuong Tran (figure 2). Of these, only May Trung, Bai Son, and Bah Linh Mot are primary deposits; the others are secondary placer deposits. Bai Son, reported by Senoble (2010), was no longer being mined as a primary deposit during our visit in February and March 2012. May Trung is divided into two sites located about 150 meters from each other: a marble cliff that is mined for red and lavender spinels, and a second site that is mined for blue spinel from a vein in marble.
GEOLOGY
The rich tectonic history of Southeast Asia is inherited from several deformation episodes related to the closure of the Paleo-Tethys Ocean and, later, to the Himalayan orogeny. The geology of northern Vietnam is dominated by metamorphic rocks inherited from these two major orogenic events. The first one, the Indosinian orogeny, led to the collision of the main shields (Yangtze and Indochina) during the Permo-Triassic at about 240–245 Ma (Kušnír, 2000; Lepvrier et al., 2008; Huong et al., 2012). In the later orogeny, the Himalayan collision during the Tertiary period, the terrains were strongly reworked. These terrains are primarily composed of metamorphic rocks, mainly medium-grade mica schist, marble, and granulitic gneisses (Kušnír, 2000; Leloup et al., 2001; Hauzenberger et al., 2003).
Northern Vietnam has been studied extensively to understand how a continental collision (in this case, between India and Eurasia) induced crustal wedges to extrude laterally into the surrounding plates. (Tapponnier et al., 1982, 1990; Leloup et al., 1995, 2001; Jolivet et al., 2001; Anckiewicz et al., 2007). During the Oligo-Miocene (from 35 to 17 Ma), the Indo-Eurasian collision induced strong rock deformation over all of Southeast Asia. The Indochinese block was extruded toward the southeast, and this induced the Red River Shear Zone, extending from the Tibetan plateaus to the China Sea for more than 1,000 km (Jolivet et al., 2001; Leloup et al., 2001; Hauzenberger et al., 2003; Anckiewicz et al., 2007). The Yen Bai province is formed by two different geological units separated by a fault that is part of the Red River shear zone. To the northeast lies the Lo Gam zone, and to the southwest the Day Nui Con Voi range (figure 3).
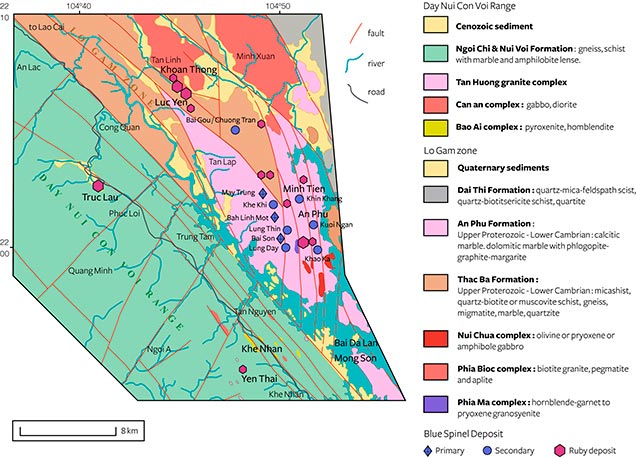
All of Luc Yen’s gem deposits are located in the Lo Gam zone (again, see figure 3). The structure of this unit results from the deformation of the Himalayan orogenesis superimposed on the preexisting Indosinian structure (Garnier et al., 2002, 2005). The Lo Gam formation consists of a sedimentary series metamorphosed into marble, gneiss, calc-silicates, micaschist, and amphibolite. These metamorphic rocks are sometimes intruded by granitic and pegmatitic dykes (Leloup et al., 2001; Garnier et al., 2005, 2008). The marbles are mainly calcitic and interlayered with Al-, V-, and Cr-rich amphibolites.
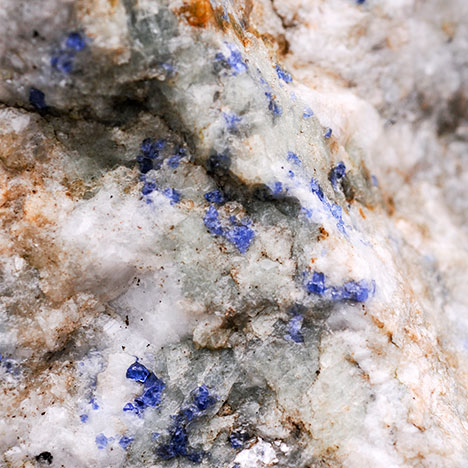
Blue spinel is found in a layer of marble more than 500 meters thick. It occurs in discontinuous series of lenses, tens of millimeters thick and meter-sized in length, roughly following the regional foliation. These marble lenses are remarkably rich in forsterite (magnesian olivine). The gem is often associated with calcite, forsterite, pargasite (sodi-calcic amphibole), sulfides, and chlorites (magnesian chlorite and clinochlore). Remarkably, blue spinel in these primary deposits is not associated with ruby or red spinel.
MINING
The three primary deposits at May Trung (22°1′48.9″ N, 104°48′42.7″ E), Bai Son (2159′47.3″ N, 104°40′9.9″ E), and Bah Linh Mot (22°1′23.7″ N, 104°48′42.8″E) are located on a mountain range composed of marble, standing about 600 meters high. Each site is mined by a handful of locals, mainly farmers trying to earn extra income. The blue spinel is extracted from the marble using hand tools (figure 4, top) and a jackhammer.
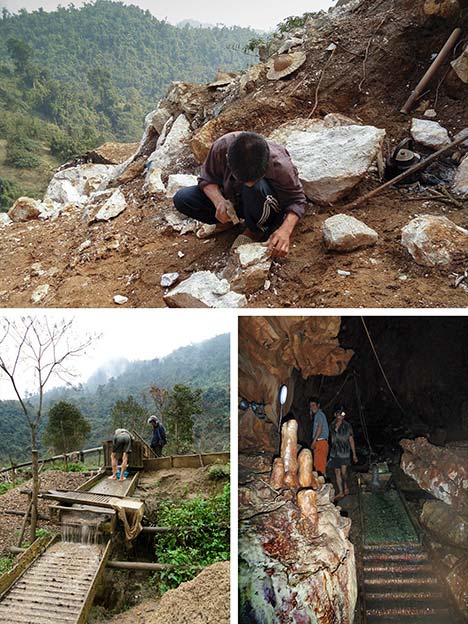
Secondary deposits (figure 4, bottom left and bottom right) yield most of the blue spinel production. Some lie in the valley to the east of the spinel-rich mountain range. These include Kuoi Ngan (22°0′7.8″ N, 104°50′41.1″ E); Khao Ka (21°59′6.5″ N, 104°50′52.5″ E); Lung Thin (22°0′12.8″ N, 104°49′31.5″ E); Lung Day (21°59′51.3″ N, 104°49′23.3″ E); and Khin Khang (22°1′46.7″ N, 104°50′9.3″ E). Khe Khi (22°1′36.8″ N, 104°48′41.2″ E) and Bai Gou (22°4′43.2″ N, 104°47′5.5″ E) are located in the mountain in a small secondary basin. Miners use a water hose and a sluice to sort the gem-bearing gravels (figure 4, bottom left). Some secondary deposits are localized in karst caves inside marble (figure 4, bottom right). Heavy gravels are washed and sorted inside the cave and brought up to the surface, where they are sorted under daylight. In secondary deposits, blue spinel is found together with ruby, red spinel, sapphire, tourmaline, and occasionally gold.
PRODUCTION AND DISTRIBUTION
In secondary deposits, blue spinel is a by-product of ruby and red spinel mining. Even so, some large parcels contain more than a thousand carats of millimeter-sized, very saturated blue spinel (see Pardieu, 2012). Some dark grayish blue stones weighing approximately 5 ct have been faceted, but far fewer than ruby and red spinel.
Blue spinels from primary deposits are found in two different forms. Usually miners encounter them in “pockets” as centimeter-sized crystals, occasionally with a pleasing, well-defined octahedral shape with some portion containing gem material, or as aggregates of small octahedral crystals of varying quality. These are broken down or cobbed by miners to extract a small amount of gem spinel. These gem blue spinel can reach 5 ct, but they are often fractured. Spinels are also found as millimeter-sized octahedra or twins in the marble.
The blue spinel’s hue, tone, and saturation vary from one deposit to the next. In the secondary Bai Gou deposit, the crystals have a very dark blue color and often reach 10 ct. In Chuong Tran and Bai Son, the spinel has a bright blue color (Senoble, 2010; Overton and Shen, 2011) and can reach 5 ct. Crystals from May Trung and Khe Khi have a very saturated cobalt blue color but are quite small (rarely larger than 1 ct).
Millimeter-sized blue spinels from the primary deposits are often kept in marble so that the whole piece can be carved. This is done directly at the mining site, and the carvings are taken down to the valley to be sold as decorative pieces.
MATERIALS AND METHODS
Sample Collection. In early 2012, two field trips were organized to collect samples and map the main blue spinel deposits within the Luc Yen district. The first expedition enabled us to visit most of the corundum and spinel deposits and to understand the geology of this area. We also made contact with local merchants and miners for the second expedition just one month later. On the second field trip, we visited only blue spinel deposits and collected whole rock and gem-bearing samples. Most of the rock samples were collected at the mining site. Unfortunately, we did not observe gem samples at the mining sites. All gem blue spinels for spectroscopic and gemological measurements were procured from several local merchants in Yen The.
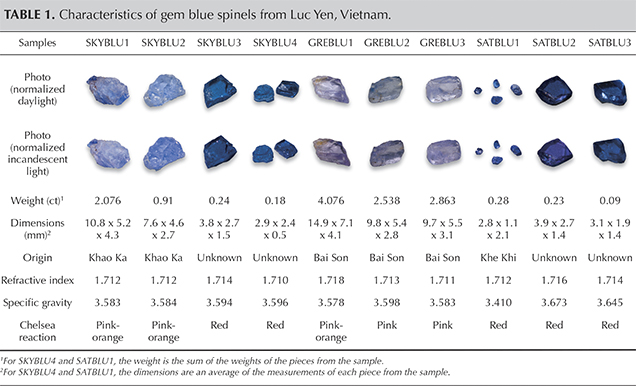
Materials. From the 55 carats of blue spinel we collected from local merchants, six representative rough crystals were selected and prepared in parallel-window plates for gemological and spectroscopic investigation. The least included and fractured samples were chosen for spectroscopic analysis. A polished window was prepared on each one to facilitate gemological and microscopic examination. One additional sample similar to SATBLU1 in color and saturation (labeled SATBLUchem) was prepared as a polished section for laser ablation–inductively coupled plasma–mass spectrometry (LA-ICP-MS) chemical analysis. Four additional samples from a later field trip by author EF were added to complete this study. These were also purchased from local merchants. The spinels were divided into three different parcels according to their color category (detailed in “Gemological Characteristics” below). The sample names consisted of the color category (GREBLU, SKYBLU and SATBLU) followed by a number; see table 1. Moreover, 73 rock samples were collected in the field from 11 different mining sites. From these, 19 thin sections were prepared for petrographic examination.
Methods. Gemological Properties. Specific gravity was measured hydrostatically with a Mettler Toledo JB703-c/FACT (with a precision of 0.001 ct). Internal features were observed with a standard gemological microscope. Refractive index was measured with a PФ-І refractometer with Rayner SVLS orange light. All spinel samples were observed under a 6 W A-Krüss Optronic 240 UV light, and we also tested their Chelsea filter reaction. Color was documented under normalized daylight (D65) and a normalized incandescent light (A).
Spectroscopic Measurements. UV-Vis-NIR absorption spectra of each sample (window plates) were taken with a Cary 5G Varian spectrophotometer in the 200–1500 nm range with a sampling interval of 1 nm and a spectral bandwidth of 1 nm maximum (sampling and spectral bandwidth were sometimes reduced to 0.25 nm to obtain better resolution). Raman spectra were collected on gem samples using both a Jobin-Yvon Labram with a 514 nm, 50 mW laser excitation, and a Jobin-Yvon Spex Horiba T64000 with a 647 nm, 50 mW laser excitation. The spectral range extended from 40 to 1500 cm–1 with a two-second exposure.
Chemical Composition. LA-ICP-MS chemical analysis was conducted at Blaise Pascal University (Clermont-Ferrand, France) using an Agilent 7500 spectrometer with a Resonetics M-50E laser (193 nm ablation wavelength, 5 Hz frequency with an energy between 10 and 12 J/cm2). For these analyses, four indentations (about 73 µm in diameter) were ablated on each sample, and 27Al was used as the internal standard. Data was processed with the GLITTER 4.4.2 software. To complement these analyses, we used a RIGAKU NEX CG energy-dispersive X-ray fluorescence (EDXRF) spectrometer operating at 25 kV and 0.10 mA. The detection limit for the major elements (Al, Mg) is about 0.1 wt.%, and below 0.01 wt.% for the minor elements. Each sample was measured for 90 seconds.
Petrographic Examination. Thin sections of rocks were observed with a standard Wild Makroscope M420 petrographic microscope, and a JEOL JSL-5800 LV scanning electron microscope (SEM) operating at 20 kV and 0.3 nA electron beam, with a 37° take-off angle of the detector. Mineral compositions of the samples and their inclusions were first determined by energy-dispersive spectroscopy (EDS) using an IMIX-PTS detector. This detector uses a high-resolution (115 eV) Ge crystal and an ultrathin polymer window, detecting elements ideally down to boron, if it is a major component of the material. The calibration standards used were either pure elements or simple compounds. The PGT software applies phi-rho-z data correction for the effect of X-ray absorption in the analyzed material, taking into account all the matrix effects. Oxygen was calculated from the spectrum, not based on stoichiometry.
GEMOLOGICAL CHARACTERISTICS
Visual Appearance. We separated the spinel samples into three categories according to their color descriptions:
- SATBLU samples: medium to medium dark tone, strong to vivid saturation, and blue to violetish blue hue
- SKYBLU samples: medium light to very light tone, strong to very vivid saturation, and blue hue
- GREBLU samples: medium light to light tone, grayish to slightly grayish saturation, and blue to bluish violet hue
All of the rough samples were slightly fractured and contained very few inclusions. Color was homogeneous in each stone, and most showed a subtle color change from blue under daylight-equivalent normalized light (D65) to violetish blue under incandescent light (see table 1). The authors avoid the commonly used term “color shift” (Senoble, 2010), which Manson and Stockton (1984) defined in garnets while observing the combination of two color phenomena, nowadays identified separately: classical color change with lighting, and Usambara effect (change of color with thickness). We observed that the color change is more pronounced in stones with a more saturated color. While examining numerous parcels in Yen The, we observed that most of the grayish blue spinel—and some of the very saturated blue material, contrary to our other observations—did not show any color change.
Blue spinel from secondary deposits (except Khe Khi) is rounded and can reach several tens of carats. In Khe Khi, blue spinels are found as millimeter-sized octahedra.
Optical and Physical Properties. The samples’ refractive index ranged from 1.711 to 1.718, and their specific gravity was from 3.578 to 3.673. They were isotropic, with no anomalous double refringence, and inert under both short- and long-wave UV light. Under the Chelsea filter, all the samples appeared pink to red (see table 1 for details). We observed that the darker the spinel, the redder the Chelsea filter reaction.
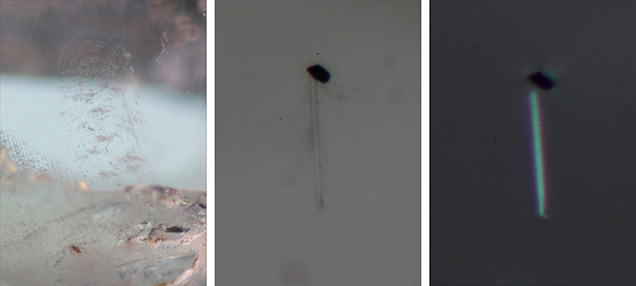
Microscopic Characteristics. Conchoidal fractures and “fingerprint” healed fractures were often present in our samples (figure 5, left). Some showed elongated tubes, while others contained groups of parallel tubes. We observed birefringence in some of these tubes, which suggested that they consisted of an anisotropic solid phase (figure 5, middle and right). Black, opaque, irregular to hexagonal crystal inclusions less than 1 mm, reminiscent of graphite, were also found in some samples (figure 5, middle and right). GREBLU1 was the only sample that had yellowish fractures covered by red crystals (probably ferric oxide hematite).
PETROGRAPHY AND CHEMISTRY OF HOST ROCKS
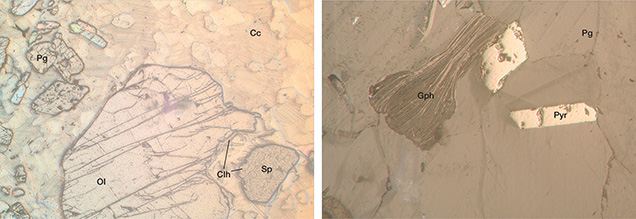
Minerals. The marble that hosts blue spinel is mainly composed of calcite (sometimes magnesian) and dolomite. The major additional phases are olivine and pargasite (figure 6). Several accessory phases were identified using the petrographic microscope or EDS with SEM. These included titanite, rutile, zircon, graphite, apatite, several sulfide minerals (again, see figure 6), and phyllosilicates. The sulfides were mainly pyrrhotite (Fe1–xS; monoclinic) with pentlandite exsolution lamellae ((Fe,Ni)9S8; cubic) and violarite (FeNi2S4; cubic). Raman spectroscopy helped to distinguish between different phyllosilicates, mainly clinochlore and phlogopite. Humite was not observed in the marble, although this mineral is associated with red or purple spinel, as well as ruby (Hauzenberger et al., 2003; Garnier et al, 2008).
Texture. The marble that hosts blue spinel has a granoblastic texture, with millimeter to centimeter grain size. SEM imaging with a backscattered electron detector showed exsolution features between calcite and dolomite, and intergrown apatite and calcite (figure 7a). Pentlandite lamellae in pyrrhotite present two different morphologies. The first consists of parallel flat lamellae less than 500 nm thick, crossing some pyrrhotite crystals from end to end. The second is lens-shaped, more than 1 µm thick and about 3 µm long, often associated with parallel flat lamellae (figure 7b).

Paragenesis. Blue spinel is observed only in olivine-rich lenses, associated with dolomite and calcite (figure 8). No blue spinel is observed in the marble when olivine is absent. The spinel-rich lenses are elongated nearly parallel to the regional foliation: roughly 45° toward the northeast. Spinel and pargasite show inclusions of apatite and sulfides similar in shape and composition for both host minerals. This suggests that apatite and sulfides preexisted spinel and pargasite. In some titanite crystals, SEM imaging revealed inclusions of zircon and pargasite. Therefore, titanite probably represents a later stage of mineralization. Clinochlore crystals surround all the other minerals (figure 7c), meaning it probably crystallized later during a hydration phase, and possibly during exhumation.
![Mable-hosted lenses in which blue spinel deposits appear] Mable-hosted lenses in which blue spinel deposits appear]](https://www.gia.edu/images/SP15-Chauvire-fig8-comp-179103-636xv2.jpg)
CHEMICAL COMPOSITION
Spinel. The composition of the three types of spinel crystals was measured in thin sections using EDS, and all rough samples were analyzed by EDXRF. These analyses identified them as spinel sensu stricto (MgAl2O4). Table 2 presents LA-ICP-MS chemical analyses on representative samples of the three color categories. The main impurities detected were Li, Fe, and Zn. Significant traces of Be, Ti, V, Cr, Mn, Ga, Ni, and Co were also detected. All analyzed spinels had concentrations of Ga, Zn, and Li, consistent with those observed only in natural blue spinel (Muhlmeister et al., 1993; Krzemnicki, 2008; Saeseaw et al., 2009). All the samples presented nearly uniform concentration in iron and in copper: around 10,000 ppma (equal to 1 atomic percent) and 4 ppma, respectively. The other elements showed strong variation among samples. Sample SATBLUchem (saturated blue) was enriched in Ti, V, Cr, Mn, Co, and Ni compared to the other samples. Samples SKYBLU1 and GREBLU2 were enriched in Be and Zn compared to SATBLUchem. GREBLU2 is also enriched in Li and Ga compared to the two others.
| TABLE 2. Trace-element composition of three spinel samples, measured by LA-ICP-MS. | ||||
| Element (ppma) |
Detection Limit (ppma) |
SKYBLU1 | GREBLU2 | SATBLUchem |
| Li | 4 | 2778 | 6030 | 2120 |
| Be | 10 | 552 | 946 | 32 |
| Ti | 2 | 3 | 3 | 202 |
| V | 1 | 11 | 6 | 362 |
| Cr | 3 | 16 | 8 | 1111 |
| Mn | 5 | 238 | 106 | 287 |
| Fe | 20 | 11,009 | 9362 | 12,794 |
| Co | 0.2 | 84 | 22 | 1236 |
| Ni | 1 | 85 | 29 | 2514 |
| Cu | 1 | 4 | 4 | 4 |
| Zn | 4 | 7242 | 4887 | 1047 |
| Ga | 0.2 | 299 | 1088 | 234 |
Host Rocks. The chemical composition and characteristics of associated minerals were also examined with EDS analysis. Olivine is 99% pure forsterite (Mg2SiO4). Pargasite is rich in titanium, sodium, and chlorine. Apatites are fluorapatites with up to 20% chlorine in substitution of fluorine. In two thin sections, we analyzed one REE-rich unknown mineral and several molybdenum- and tungsten-rich unknown minerals. Cobalt was found in sulfides, as high as 1.5 wt.% in pentlandite and 3.5 wt.% in violarite.
SPECTROSCOPIC PROPERTIES OF BLUE SPINEL
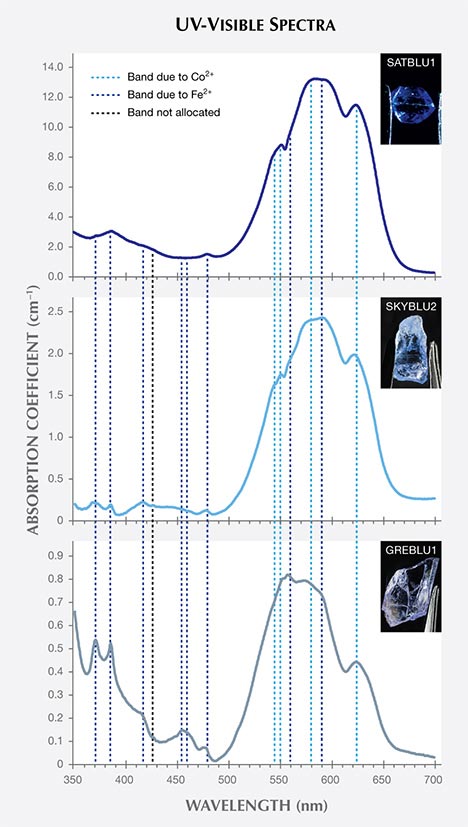
UV-Vis Absorption Spectra. All UV-visible spectra showed a broad, intense absorption band between 500 and 670 nm composed of several narrower bands at about 545, 550, 560, 580, 590, and 625 nm (figure 9). Two transmission windows were seen in the visible part of the spectra, in the violet to blue region (400–500 nm) and in the red region (670–700 nm). We also observed several weak peaks between 300 and 500 nm at about 371, 386, 418, 427, 455, 460, and 480 nm. The bands at 427 and 460 nm are not visible on the spectra that show the most intense main band between 500 and 670 nm (samples SKYBLU2 and SATBLU1). Additionally, we noted a large, weak band centered at about 440 nm only on the SKYBLU samples. For samples GREBLU1 and SATBLU1, we also note an increasing absorption from 450 nm toward the UV.
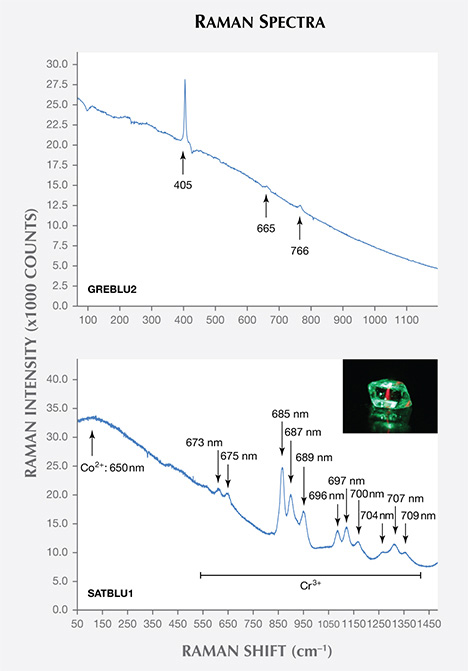
Raman and Luminescence. The Raman spectra were typical of spinel, with weak peaks at 405, 665, and 766 cm–1 (figure 10a; Fraas et al., 1973). The 405 cm–1 peak was 9 cm–1 wide, evidence that the analyzed spinels were natural and unheated (Krzemnicki, 2008; Saeseaw et al., 2009). However, this Raman signal of spinel was overwhelmed by luminescence with the two available excitation wavelengths (514 or 647 nm). The luminescence band was centered at 107 cm–1 for the 647 nm excitation wavelength, corresponding to a 650 nm emission (figure 10b). In this case, the sample showed a strong red luminescence (figure 10b, inset) consistent with a broad band emission centered at 650 nm. In addition, many weak peaks between 673 and 710 nm, grouped in apparent triplets, were visible: 685, 687, and 689 nm; 696, 697, and 700 nm; and 704, 707, and 709 nm (figure 10b).
DISCUSSION
Primary Geological Origin. Red and blue spinels are always found in marble (figure 11). Garnier et al. (2008) proposed that this marble originated from an old carbonate platform (considered Precambrian to Permo-Triassic), which later metamorphosed. Graphite crystals in these Vietnamese marbles likely derive from metamorphism of organic matter (Giuliani et al., 2003; Garnier et al., 2008). As already mentioned, blue spinels are always associated with olivine (nearly pure forsterite). This paragenesis is typical of the granulitic metamorphic facies (high temperature above 550°C for a CO2-rich system; Bucher and Frey, 1994; Janardhan et al., 2001; Proyer et al., 2008). Pargasite is ubiquitous in marble, also representing a high-temperature phase. Pargasite, olivine, and spinel are nearly contemporaneous, and they may have crystallized from the destabilization of diopside with increasing pressure and temperature in a prograde reaction (Proyer et al., 2008; Ferry et al., 2011).
We detected some fluorine and chlorine in apatite and pargasite, and some sodium, lithium, and beryllium in blue spinel. These elements are indications that evaporitic rocks played a role during metamorphism (Proyer et al., 2008). Giuliani et al. (1993) and Garnier et al. (2005, 2008) also proposed this hypothesis from the study of fluid inclusions in gem ruby from the Luc Yen area.
Different areas yielding ruby and red or blue spinel show distinct characteristics. Red spinel and rubies have a very similar paragenesis. Forsterite is only associated with blue spinel, and clinohumite is only associated with red spinel. Clinohumite can also grow from diopside in a prograde reaction with dolomite and water (Proyer et al., 2008). Ruby-bearing rocks are very different from those containing blue spinel, as they underwent different metamorphic histories. Because of the intense tectonic activity in Luc Yen, it is possible that two rocks with very different geological histories have been brought in contact.
Garnier et al. (2008) did not observe evidence of a fluid circulating through the marble. They proposed that aluminum and chromium originally sedimented within the carbonate platform. These elements were mobilized due to the presence of halogen elements (fluorine and chlorine) from evaporitic rocks. We propose that the mobilization of Ni and Co happened through the same process. Another hypothesis is that Ni and Co were mobilized from amphibolitic rocks interlayered in the marble (observed by Garnier et al., 2006) via halogen-rich fluids. Fluids can be formed by the metamorphism of clay minerals, evaporate, and organic matter (Giuliani et al., 2003; Garnier et al., 2008).
Proposed Geological History. The ancient Paleo-Tethys Ocean (possibly Proterozoic to Permo-Triassic) separated the China (Yangtze) and Indochina cratons (now Vietnam, Laos, Cambodia, Thailand, and Myanmar). In this ocean, a carbonaceous platform developed by sedimentation. Tectonic movements caused the closing of this ocean, and evaporitic minerals were deposited. The two main blocks (Yangtze and Indochina) subsequently collided, and all the sedimentary and magmatic rocks of the oceanic crust underwent intense deformation and metamorphism. During the collision, the metamorphism of the mix of former carbonate platform minerals and some detritic material (such as clays) deposited with it may have led to the formation of diopside through the following reactions:
tremolite + calcite → diopside + dolomite
dolomite + quartz → diopside + carbon dioxide
By increasing metamorphism, diopside destabilized into olivine, spinel, and clinohumite. The reduction of evaporitic minerals such as sulfates formed chlorine- and fluorine-rich fluids. These fluids were involved in the mobilization of aluminum and other elements such as chromium (Giuliani et al., 2003; Garnier et al., 2008).
Some processes remain poorly understood. Why do some areas show clinohumite with red spinel while others show olivine and blue spinel? What is the main difference responsible for mobilizing more chromium (red spinel) or more cobalt (blue spinel) in the marble?
Origin of Blue Color and Color Change in Vietnamese Blue Spinels. The main absorption band between 500 and 670 nm, the dominant origin of color in these blue spinels, is composed of a series of bands at approximately 545, 550, 560, 580, 590, and 625 nm (again, see figure 9). Bands at 545, 550, 580, and 625 nm are due to cobalt (Co2+) substituting for Mg2+ in tetrahedral sites of the spinel structure (Wherry, 1929; Pappalardo et al., 1961; Shigley and Stockton, 1984; Kuleshov et al., 1993; Muhlmeister et al., 1993; Delaunay et al., 2008; Duan et al., 2012; Bosi et al., 2012; D’Ippolito et al., 2015). The remaining absorption bands (at 371, 386, 418, 455, 460, 480, 560, and 590 nm) are allocated to iron (Fe2+) in tetrahedral sites of the spinel structure (Gaffney, 1973; Dickson and Smith, 1976; Muhlmeister et al., 1993; Delaunay et al., 2008; D’Ippolito et al., 2015). A weak band observed at 427 nm is not attributed but may be linked with other measurable elements such as Ni. Consequently, the spectra show transmission windows between 300 and 500 nm and between 700 and 900 nm that explain the blue color. As expected, the spectra show that iron (Fe2+) and cobalt (Co2+) are the main chromophore elements. The other trace elements detected either do not give rise to absorption in the visible range or are much less efficient absorbers than cobalt. Chromium, which is the main chromophore for red and pink spinel, makes a significant contribution to color if the concentration is above 1000 ppma. (Muhlmeister et al., 1993; T. Häger, pers. comm, 2014). Cr concentration in SATBLU samples is borderline, but the Co concentration is higher, too. The contribution is considered negligible.
We observed that the SATBLU samples, which had the most saturated color, also had the most important cobalt optical absorption. In addition, the main band had an absorption coefficient greater than 10 cm–1, and the iron optical absorptions observed were weak. For the parcel classified as SKYBLU, iron and cobalt optical absorption seemed to have a similar importance in the optical spectra, reaching a maximum of 2 cm–1 as compared to SATBLU samples. GREBLU samples had the most significant iron band, but the main absorption band only reached 0.5 cm–1. We also observed a correlation between the cobalt absorption bands and the color saturation.
SATBLU2 had a Fe/Co value of approximately 10 (table 2), and the SATBLU samples had the most saturated color (table 1). GREBLUE2, with a Fe/Co ratio of about 425 (table 2), had a visible gray hue component (table 1). For intermediate Fe/Co ratios of about 130 (measured on SKYBLU1; see table 2), the spinel had a sky-blue color (table 1). Moreover, sample GREBLU1, which had the grayest color, showed more significant bands due to Fe2+. We propose that the GREBLU samples are colored mainly by iron and the SATBLU samples by cobalt. The SKYBLU samples’ colors arise from both iron and cobalt absorption. Hue differences are more significantly controlled by iron (with different species), while saturation is largely dictated by cobalt (D’Ippolito et al., 2015).
Using chemical and spectroscopic analysis from eight of our samples, we calculated the molar absorptivity of cobalt in spinel (sensu stricto) for three absorption bands. At wavelengths of 545, 580, and 625 nm, we took the apparent maximum of each band. We determined a molar absorptivity of 530±29, 664 ±18, and 586±11 L·mol–1·cm–1, respectively. For the sake of comparison, we calculated the molar absorptivity of iron in spinel (sensu stricto) for bands 371, 386, 480, and 590 nm. These bands are attributed to ferrous iron (Fe2+) in the tetrahedral site. Our chemical analysis measured only the total iron content. Assuming all iron was in the form Fe2+, we propose that the molar absorptivity of ferrous iron in the tetrahedral site had an order of magnitude of about 30 L·mol–1·cm–1 for each band. With this method, values of molar absorptivity are not very accurate but provide a working assumption for our preliminary study. We recognize that further investigation is needed to fully understand the color in blue spinel. A Gaussian decomposition of spectra can improve the precision of these values. Nevertheless, it is apparent that in spinel, Co2+ is approximately 20 times more efficient at absorbing light, and thus creating color, than Fe2+ (consistent with D’Ippolito et al., 2015).
Spectra have two transmission windows between 350 and 500 nm (in the blue region) and between 670 and 900 nm (in the red region). This explains the pink to red reaction under the Chelsea filter and the color change. Indeed, the Chelsea filter probes a transmission window in the red. The color change is also explained when the spectral composition of the lighting environment is compared with the absorption spectra of spinel, although this change is not observed in every example. Compact fluorescent light emits more in the blue region than in the red, and therefore the spinel appears blue. Under incandescent light, which is richer in red, spinel displays a violetish blue color that is mostly blue with minor red.
Origin of Red Luminescence. Under laser excitation, our samples showed a strong red luminescence. In spectra acquired using a 647 nm excitation, we observed several peaks (in groups of three) between 673 and 710 nm (at about 673, 675, 685, 687, 689, 696, 697, 700, 704, 707, and 709 nm; see figure 10b). These peaks are known to be due to trivalent chromium (Cr3+) substituting for aluminum in the octahedral site (Burns et al., 1965; Wood et al., 1968; Skvortsova et al., 2011). The broad band centered at 650 nm is allocated to divalent cobalt in the tetrahedral site of the spinel structure (Abritta and Blak, 1991; Kuleshov et al., 1993). These luminescence behaviors are consistent with our chemical analysis, as the strongest luminescence was observed in the SATBLU samples, which had higher concentrations of Cr3+ (1111 ppma) and Co2+ (1236 ppma).
CONCLUSION
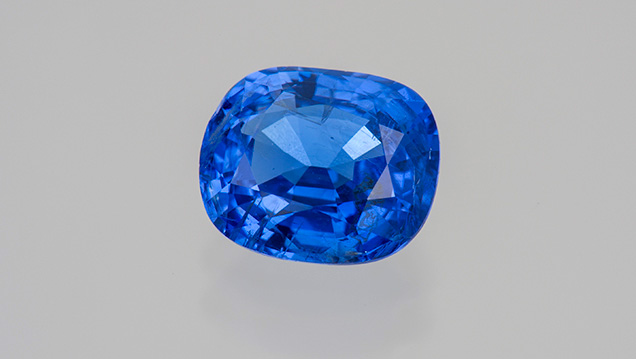
We confirmed that the saturated “cobalt-blue” color of Vietnamese spinels (figures 12 and 13) is due predominantly to Co2+ substituting for Mg2+ in the tetrahedral site of the spinel structure. For the most saturated blue spinel, cobalt is the main coloring agent, even if iron is more abundant. Indeed, cobalt is a powerful coloring agent, with a molar absorptivity between 500 and 700 L·mol–1·cm–1 depending on wavelength, whereas iron (Fe2+ in the tetrahedral site) has a molar absorptivity of about 30 L·mol–1·cm–1. The higher the iron/cobalt ratio is, the grayer the color. The red transmission window of these gems explains both their pink to red Chelsea filter reaction and their slight change of color from blue to “lavender” with a change of lighting environment. The red luminescence is due to both Cr3+ and Co2+, and it may have a minor influence on the perceived color.

This study offers clues to the definition of “cobalt-blue” spinel. Cobalt is actually the main chromophore, but the presence of iron is also significant. The term “cobalt-blue” can be clarified by further investigations on the significance of each chromophore elements (iron and cobalt). These investigations can propose a limit on the ratio of iron/cobalt above which the term “cobalt-blue” cannot be used.
Spinels from Luc Yen contain few inclusions. Fractures and fingerprints were the most common inclusions found. Sometimes, we observed parallel elongated tubes with black, irregular solid inclusions associated.
From a geological standpoint, gem-quality blue spinels are associated with intense metamorphism. Their marble host results from the metamorphism of an ancient carbonaceous platform. This platform was located in the Paleo-Tethys Ocean, which separated Indochina and China. During the convergence of these “paleo-continents,” the ocean closed off, accompanied by the formation of evaporitic rocks. The ocean crust, associated with the carbonaceous platform and evaporitic platform, was sandwiched between the two continents. The collision led to the metamorphism of the evaporite rocks, in turn producing fluids mobilizing some elements, possibly including cobalt. Spinel grew in the marble during this intense metamorphism. These processes of metamorphism and fluid interaction led to the crystallization of attractive blue spinels in the marble mountains of Luc Yen.


